The emergence of COVID-19 brought a rapid end to the drawn-out recovery of major stock markets from the share price lows associated with the financial crisis a decade ago. When the scale of the threat to lives and livelihoods became apparent, market analysts and investors reassessed the global economic outlook and corporate prospects; they didn’t like what they saw and a wave of selling followed, with inevitable consequences. Most share prices, and thus stock indices, were impacted, with market volatility continuing throughout 2020.
Market analysts and investors aren’t infallible, but when something like COVID-19 strikes they get nervous because closed borders, flight bans and lockdowns can pose a threat even to large companies, especially in exposed sectors. Axed dividends and distressed rights issues are anathema to the jittery; and the largest blue-chip companies aren’t immune. Little wonder then that the 100 shares comprising the UK’s blue-chip share index, the FTSE 100, rapidly lost about one-third of their combined value in late Februaryv and March 2020.
Lessons from history
Created in 1984 with a starting level of 1,000 points to provide a wider index of leading shares quoted in London, the FTSE 100 largely superseded the narrower Financial Times 30-share index launched in 1935. As a barometer of economic outlook and corporate prospects, the FTSE 100 has gauged a few storms over the past 36 years. A chart of its progress reveals a plethora of spikes and dips, the starkest of which can be associated with key events in recent financial history.
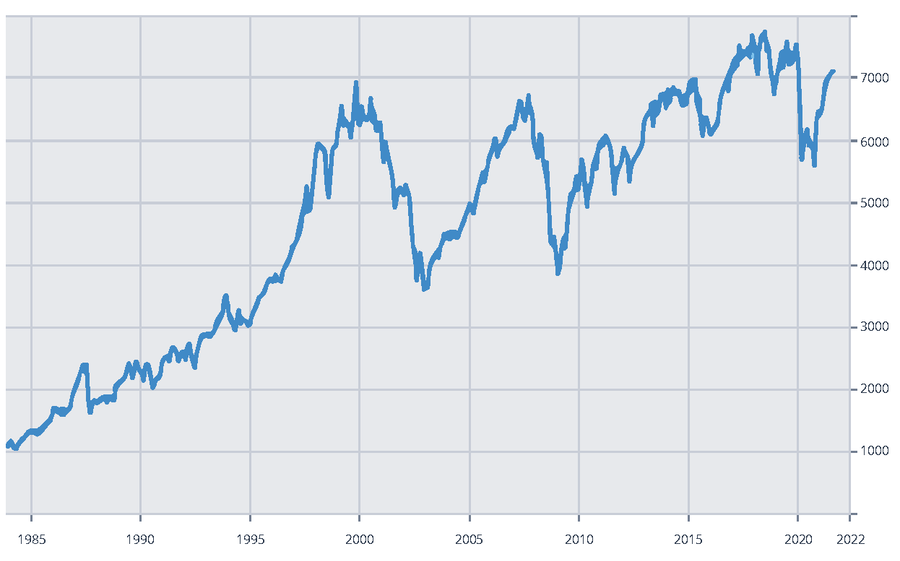
Chart: FTSE 100 since inception to 1 September 2021, source Yahoo and Trading Economics
Not the first FTSE 100 dip
After its launch on 3 January 1984, the FT’s new share index only slipped very briefly below 1,000 points that year. It then made progress, sometimes faltering, to hit 2,000 points by March 1987, by then buoyed by the effect of the previous October’s ‘Big Bang’ modernisation of the London Stock Exchange’s trading structure. Six months of further upticks followed and the index broke through 2,350 in early October 1987. It would be two years before that level was attained again.
On 19 October 1987, the Monday after The Great Storm ravaged Southern England, global stock markets suffered a crash so severe that the day became known as Black Monday. A tsunami of selling, much of it blamed on new-fangled computer-program trading, rapidly took the FTSE 100 down to around 1,600, starting with an 11% drop on the Monday and 12% the next day.
A 1,000-point drop
High interest rates and other threats to UK economic growth and even talk of an impending recession brought a 1,000-point drop in the FTSE 100 in the
The bull market had marched the FTSE 100 up the hill; the ensuing
Long term trend
It was a long haul back from there for the FTSE 100 but, after gyrations associated with various stages of the Brexit process, the start of 2020 saw it comfortably above 7,000. News of a new virus outbreak in an unfamiliar Chinese city seemed at first like a distant threat. As the outbreak turned into a pandemic, global markets faltered again and the FTSE 100 headed below 5,000 before recovering some of the loss. COVID-19 has brought a reset of the blue- chip barometer, the FTSE 100 index.
Despite a variety of market shocks and rebounds, the index still has a long term growth trend. It is important to remember that some market volatility is inevitable; markets will always move up and down. As an investor, putting any short-term market volatility into historical context is useful.
Financial advice and regular reviews are essential to help position your portfolio in line with your objectives and attitude to risk, and to develop a well-defined investment plan, tailored to your objectives and risk profile.
The ascent of the 1990s
Share-price recovery was slow, hampered by a short UK recession in 1991-92 caused in part by high interest rates and an over-valued pound associated with efforts to keep sterling within Europe’s exchange rate mechanism. After Chancellor Norman Lamont took sterling out of the ERM in September 1992, having spent billions and upped base rate to 15% trying to stay in, the index gained about 14% in six months.
As 1994 dawned, a decade on from its launch, the FTSE 100 stood at around 3,400; although then, as now, changes had been made to its constituent shares as companies’ respective market capitalisations waxed and waned. Concerns about the economy and tax plans dampened sentiment and the index fell below 3,000 during the first half of 1994 before starting a five-year ascent to break the 6,000 barrier in the summer of 1998. After a 500% rise in 14 years, what came next for the FTSE 100?
The value of investments can go down as well as up and you may not get back the full amount you invested.
The past is not a guide to future performance and past performance may not necessarily be repeated.
Tees is here to help
We have many independent financial advisers who are based in:
Cambridgeshire: Cambridge
Essex: Brentwood, Chelmsford, and Saffron Walden
Hertfordshire: Bishop's Stortford and Royston
But we can help you wherever you are in England and Wales.
This material is intended to be for information purposes only and is not intended as an offer or solicitation for the purchase or sale of any financial instrument. It is not intended to provide and should not be relied on for accounting, legal or tax advice, or investment recommendations. Past performance is not a reliable indicator of future returns and all investments involve risks. Some information quoted was obtained from external sources we consider to be reliable.
Tees is a trading name of Tees Financial Limited which is authorised and regulated by the Financial Conduct Authority. Registered number 211314. Tees Financial Limited is registered in England and Wales. Registered number 4342506.